
- Title
-
Cre/lox-regulated transgenic zebrafish model with conditional myc-induced T cell acute lymphoblastic leukemia
- Authors
- Langenau, D.M., Feng, H., Berghmans, S., Kanki, J.P., Kutok, J.L., and Look, A.T.
- Source
- Full text @ Proc. Natl. Acad. Sci. USA
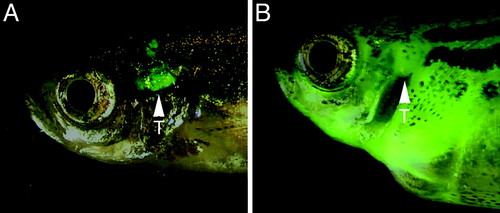
Stable transgenic rag2-EGFP-mMyc zebrafish develop GFP-labeled thymic lymphoma, which progresses to T-ALL. Fluorescence microscopic analysis at 50 days of life showing the thymus of control rag2-GFP transgenic fish (A) and massive GFP-labeled cellular dissemination of leukemic lymphoblasts in rag2-EGFP-mMyc transgenic fish (B). Fish are oriented with anterior to the left and dorsal to the top. Arrowheads mark location of the thymus (T). EXPRESSION / LABELING:
PHENOTYPE:
|
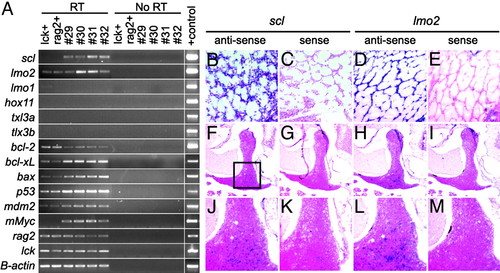
Leukemic lymphoblasts express T cell markers and both scl and lmo2.(A) Semiquantitative RT-PCR showing that Myc-induced leukemias are arrested at a stage in which scl and lmo2 are coexpressed. RT-PCR analysis of FACS-sorted, GFP-labeled thymocytes from 70-day-old transgenic lck-GFP (lck+) and rag2-GFP (rag2+) fish or leukemic lymphoblasts isolated from diseased fish (denoted by numbers). RT, reverse transcription reactions; No RT, no reverse transcription controls. (B-M) RNA in situ hybridization of paraffin-embedded sections confirms that scl and lmo2 are coexpressed in lymphoblasts from rag2-EGFP-mMyc transgenic fish (shown here infiltrating the skeletal musculature) and that scl and lmo2 are expressed in a subset of thymocytes in 70-day-old, nonleukemic, lck-GFP transgenic zebrafish. Images are photographed at 400x (B-E), 50x (F-I), and 200x (J-M). Images in J-M are higher-magnification images of the respective regions in F-I (indicated by the boxed region in F). EXPRESSION / LABELING:
|
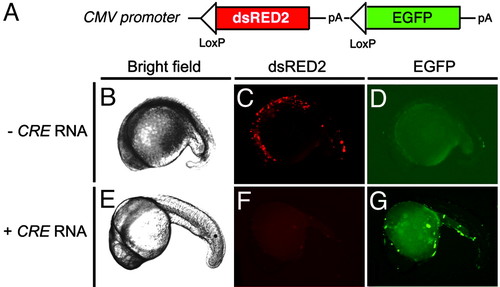
Cre-mediated recombination in transiently injected embryos. (A) Diagram of the CMV-loxP-dsRED2-loxP-EGFP construct. (B-G) One-cell-stage embryos were injected with the CMV-loxP-dsRED2-loxP-EGFP vector in the absence of Cre RNA (- Cre RNA) (B-D) or with Cre RNA (+ Cre RNA, 25 ng/μl) (E-G). Shown are bright-field (B and E), red fluorescence (dsRED2) (C and F), and green fluorescence (EGFP) images (D and G) of embryos at 26 h postfertilization. Anterior is to the left, and dorsal is toward the top. |
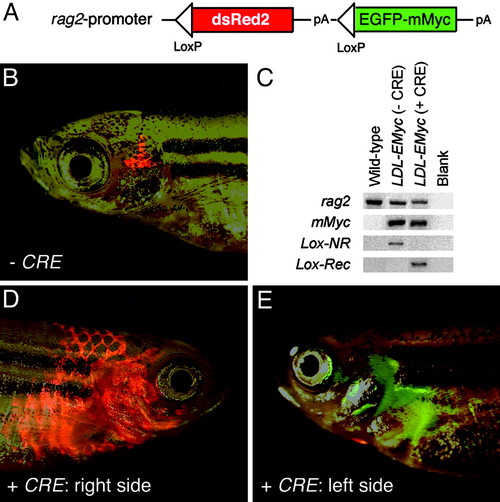
Cre RNA injection into stable transgenic rag2-loxP-dsRED2-loxP-EGFP-mMyc fish leads to transgene recombination and rapid onset of Myc-induced T-ALL. (A) Diagram of rag2-loxP-dsRED2-loxP-EGFP-mMyc construct. (B) Thymocytes from a 73-day-old rag2-lox-dsRED2-EGFP-mMyc transgenic fish are red-fluorescent-labeled in the absence of Cre expression. (C) PCR of genomic DNA isolated from blood cells of WT control or transgenic rag2-loxP-dsRED2-loxP-EGFP-mMyc (LDL-EMyc) fish. rag2 primers amplify genomic DNA, mMyc primers amplify the mMyc transgene, and Lox primers amplify either a 1.7-kb nonrecombined fragment (Lox-NR) or a 0.4-kb fragment, which results when Cre recombination has occurred (Lox-Rec). (D and E) One-cell-stage rag2-loxP-dsRED2-loxP-EGFP-mMyc embryos were injected with the Cre RNA (25 ng/μl) and grown to 51 days of development, at which time they had both GFP- and dsRED2-labeled (D) or GFP-positive alone (E) leukemias. The same fish is shown, right (D) and left (E) side. Images are composites of dsRED2 and GFP fluorescence and bright-field images. |
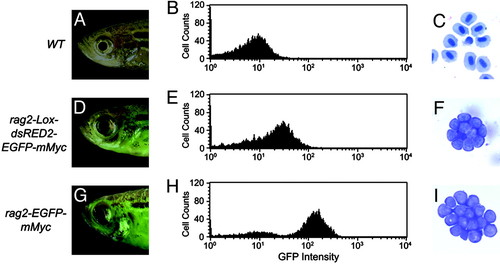
Leukemias developing in Cre-injected rag2-loxP-dsRED2-loxP-EGFP-mMyc transgenic fish are transplantable, express low levels of GFP fluorescence, and have typical lymphoblast morphology. WT control (A-C) and irradiated WT fish transplanted with lymphoblasts from rag2-loxP-dsRED2-loxP-EGFP-mMyc (D-F) or rag2-EGFP-mMyc transgenic (G-I) fish. (A, D, and G) Fluorescent microscopic analysis with fish oriented with anterior to the left and dorsal to the top. Images are a composite of GFP fluorescence and bright-field images. (B, E, and H) FACS analysis based on GFP fluorescence. (C, F, and I) Giemsa/May-Grunwald staining of blood cells obtained from cytospin analysis. Original images were photographed at 1,000x. |
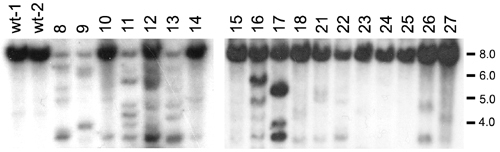
Myc-induced leukemias have oligoclonal TCR-α gene rearrangement. Southern blot analysis of genomic DNA digested with BglII and hybridized with the TCR-α constant region probe is shown. Representative DNAs of Myc-induced leukemias are shown (numbered) and compared with DNA from the thymus of rag2-GFP control fish (wt-1 and wt-2). The nonrearranged BglII restriction fragment is 8.0 kb; sizes of DNA standards in kilobases are noted to the right of blots. |
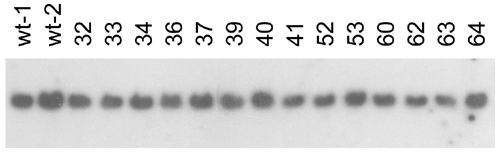
Myc-induced leukemias do not have IgM gene rearrangements. Southern blot analysis of genomic DNA digested with BglII and hybridized with the IgM constant region probe is shown. DNAs are shown from representative Myc-induced leukemias (denoted by numbers) and compared with DNAs from kidney marrow cells harvested from multiple WT control fish (wt). Sizes of DNA standards are noted in kilobases to the right of the blots. The presence of either one or two restriction fragments hybridizing to the IgM probe results from a BglII polymorphic site contained within the gene, not gene rearrangement. |
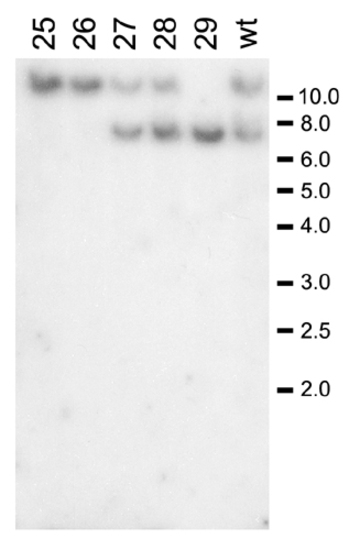
The p16 gene locus is not biallelically deleted in Myc-induced leukemias. Southern blot analysis of genomic DNA digested with BglII and probed with a p16 genomic fragment is shown. Representative sampling of Myc-induced leukemias (denoted by numbers) and compared to blood cells harvested from the kidneys of WT control fish (wt-1 and wt-2). |

Unillustrated author statements |