- Title
-
Specific and conserved roles of TAp73 during zebrafish development
- Authors
- Rentzsch, F., Kramer, C., and Hammerschmidt, M.
- Source
- Full text @ Gene
|
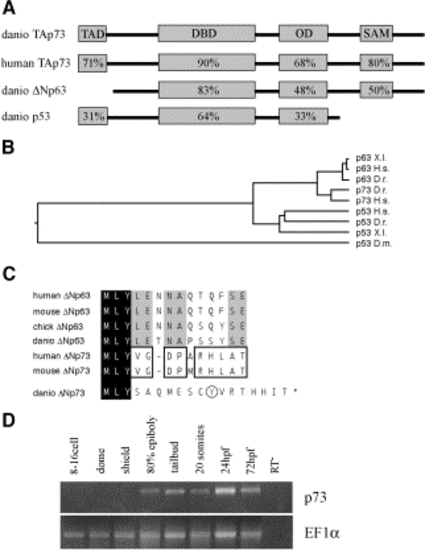
Structure of zebrafish p73 and its temporal expression profile. (A) Homology of zebrafish p73 compared to other members of this gene family. Percentages indicate amino acid identity within the respective domains. TAD, transactivating domain; DBD, DNA-binding domain; OD, oligomerization domain; SAM, sterile alpha motif. (B) Phylogenetic tree (neighbor joining method) based on an alignment of the DNA-binding domains using ClustalW (MegAlign software). X.l., Xenopus laevis; H.s., Homo sapiens; D.r., Danio rerio; D.m., Drosophila melanogaster (C) Alignment of the N-termini of known ΔNp63 and ΔNp73 proteins and a putative ΔNp73 from zebrafish. Residues shared by all ΔN isoforms are shown inverted, residues conserved in all ΔNp63 orthologues are shaded and those shared by ΔNp73 orthologues are boxed. The last residue before the in-frame splice donor site is encircled. (D) Temporal expression profile of p73 as determined by RT-PCR, with EF1α as control. EXPRESSION / LABELING:
|
|
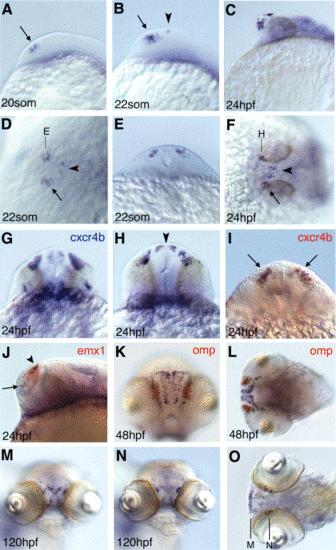
Neuronal expression of p73. (A–O) In situ hybridization for p73 stained in blue, except (G) which shows staining for cxcr4b. (A–C, J) are lateral views, (D, F, L, O) dorsal views, anterior to the left; (K, M, N) are frontal views; (E, G–I) are optical cross sections, with the focal plane of (E) indicated in (D), focal plane of (H) indicated in (F), and focal planes of (M) and (N) indicated in (O). Developmental stages are indicated in lower left corner; for (O) it is 120 hpf. Probes for double labelings in red are indicated in upper right corner. Arrows in (A, B, D, F, I, J) mark rostro-lateral cell, arrowheads in (B, D, H, J) mark caudo-medial cells. EXPRESSION / LABELING:
|
|
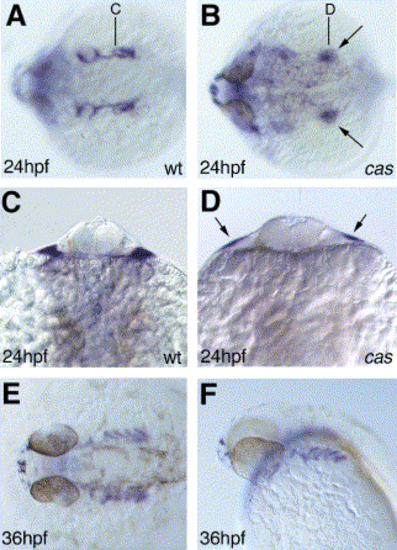
Expression of p73 in the pharyngeal endoderm. (A, B, E) Dorsal views, (F) lateral view, (C, D) optical cross sections at the level indicated in (A and B). (B, D) Show cas mutants. Arrows point to expression in putative neural crest streams. |
|
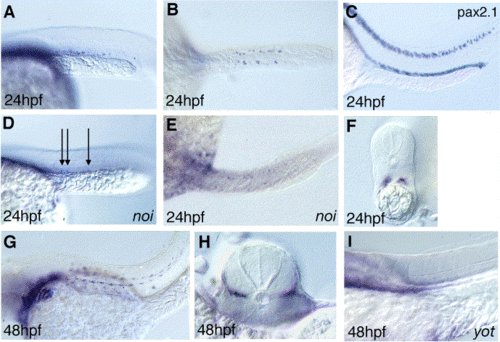
Expression of p73 in the pronephric duct (A–F) and slow muscles (G–I). (A, B, D–I) p73 expression, (C) pax2.1 expression; (A, C, D, G, I) lateral views on posterior trunk and tail region, anterior to the left, dorsal up; (B, E) are dorsal views of (A, D); (F) shows optical cross section of (B) at level of yolk extension; (H) shows optical cross section of (G) at trunk level. (D, E) pax2.1/noi mutant embryo, identified by the absence of the midbrain–hindbrain boundary. Arrows in (D) point to p73-positive cells in noi embryos. (I) yot mutant embryo, identified by its U-shaped somites. |
|
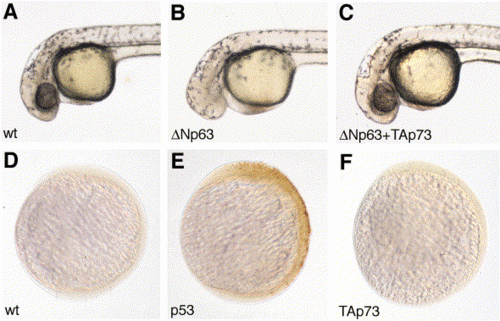
Overexpression experiments. (A–C) Embryos injected with the indicated RNAs, 31 hpf. ΔNp63-injected embryos (B) lack forebrain and eyes, resulting from ventral shifts during early dorso-ventral patterning of the ectoderm [Bakkers et al., 2002], while these structures are rescued in the embryo co-injected with ΔNp63 and TAp73 mRNA (C). (D–F) TUNEL stainings of tailbud stage embryos injected with indicated RNA, lateral view, head up. |
|
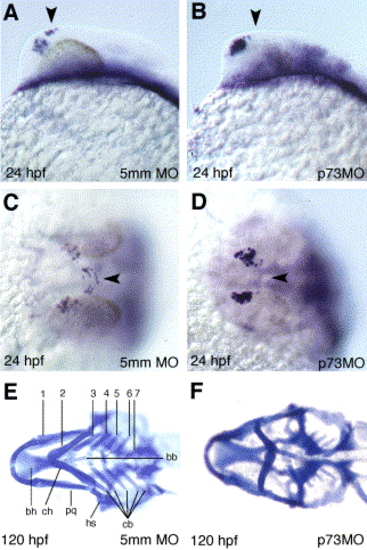
Loss-of-function experiments. (A–D) In situ hybridization revealing p73 expression in embryos injected with 5 mismatch-control MO (5mm MO) (A, C), or in TAp73 morphant embryos injected with TAp73 MO1 (p73MO) at the one-cell stage (B, D); (A, B) lateral views, (C, D) dorsal views on head. Arrowheads point to missing caudo-medial cells. (E, F) Alcian blue staining of 5 mismatch control MO-injected (E) and TAp73 MO1-injected embryo (F), ventral views on head; anterior to the left. Numbers indicate pharyngeal arches 1–7 (mandibular, hyoid and five gill arches). Abbreviations: bb, basibranchial; bh, basihyal; cb, ceratobranchial; ch, ceratohyal; hs, hyosymplectic; pq, palatoquadrate. |
Reprinted from Gene, 323, Rentzsch, F., Kramer, C., and Hammerschmidt, M., Specific and conserved roles of TAp73 during zebrafish development, 19-30, Copyright (2003) with permission from Elsevier. Full text @ Gene

