
- Title
-
Genetic analysis of zebrafish gli1 and gli2 reveals divergent requirements for gli genes in vertebrate development
- Authors
- Karlstrom, R.O., Tyurina, O.V., Kawakami, A., Nishioka, N., Talbot, W.S., Sasaki, H., and Schier, A.F.
- Source
- Full text @ Development
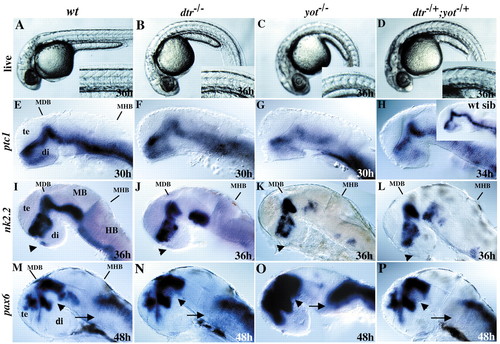
dtr–/–, yot–/–and dtr–/+;yot–/+embryos have defects in body axis formation and expression of Hh target genes in the brain. (A-D) Examination of live 36-hour embryos reveals curled body axes in dtr–/–, yot–/–and dtr–/+;yot–/+mutant embryos. U-shaped somites, indicative of defects in slow muscle cell differentiation, are seen only in yot–/–and dtr–/+;yot–/+embryos, dtr–/–embryos have wild-type somites (insets). (E-H) patched 1 (ptc1) expression is generally reduced in all three genotypes. In situ labeling was performed simultaneously and embryos were developed for the same amount of time in E, F and G. Inset in H shows wild-type sibling developed in same tube as this transheterozygote. (I-L) In all gli mutant embryos, nk2.2 expression is reduced or absent from the anterior pituitary anlage (arrowheads), as well as from different regions of the ventral midbrain and ventral hindbrain. (M-P) Expression of pax6, a gene known to be repressed by Hh signaling, is variably expanded in the MDB (arrowhead) and hindbrain (arrows). Expression of pax6 is expanded across the MDB expression domain of shh (not shown), ptc (E), and nk2.2 (I). All panels show lateral views, anterior to the left. Eyes were removed in E-P. Gene expression is indicated on the left. Di, diencephalon; HB, hindbrain; MB, midbrain; MDB, mid-diencephalon boundary; MHB, midbrain-hindbrain boundary; te, telencephalon.
|
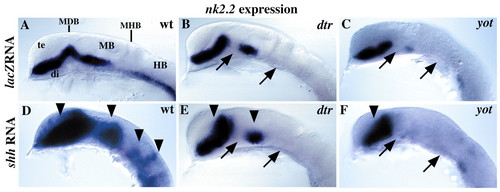
Zebrafish gli mutations block Hh signaling. (A) Wild-type expression of the Hh target gene nk2.2 is unaffected by injection of lacZ mRNA. (B,C) nk2.2 expression is regionally absent in dtr and yot/gli2 mutant embryos (arrows). (D) Injection of shh mRNA leads to an expansion of nk2.2 throughout the CNS in wild-type embryos (arrowheads). (E,F) Over expression of shh does not activate nk2.2 expression in defective regions of dtr and yot/gli2 mutants (arrows), but nk2.2 expression is expanded in unaffected regions (arrowheads). All panels show lateral views of 20-somite (19 hour) embryos, anterior to the left, eyes removed. di; diencephalon; HB, hindbrain; MB, midbrain; MDB, mid-diencephalon boundary; MHB, midbrain-hindbrain boundary; te, telencephalon.
|
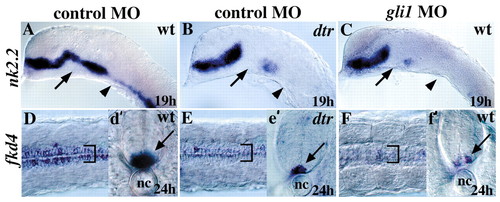
gli1 knockdown phenocopies dtr/gli1. (A) Expression of nk2.2 is unaffected by injection of a control morpholino (MO). (B) dtr/gli1 mutations eliminate nk2.2 expression in some regions of the brain (arrow and arrowhead). (C) Injection of a gli1MO into wild-type embryos leads to a loss of nk2.2 expression identical to that seen in dtr/gli1 mutant embryos (compare arrows, see also Table 1). (D) Expression of fkd4 in the medial and lateral floor plate is unaffected by control MO injections. (E) fkd4 expression is extremely reduced in dtr/gli1 mutants (compare bracket and arrow to those in D). (F) fkd4 expression is similarly reduced in lateral floor plate cells after gli1 MO injection (compare bracket and arrow to those in D). (d′, e′, and f′) show cross sections through the trunk at the level of the yolk plug. nc; notochord
EXPRESSION / LABELING:
|
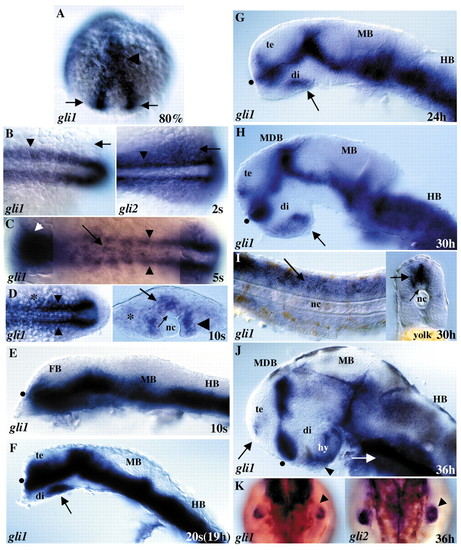
Developmental expression of zebrafish gli1. (A) 80% epiboly. Transcripts for gli1 are first detected in the anterior neural plate (arrowhead) and in pre-somitic mesoderm (arrows). (B) 2-somite stage. In the trunk, both gli1 (left panel) and gli2 (right panel) are expressed in adaxial cells (arrowheads) adjacent to the notochord. gli1, like gli2, is also expressed in paraxial mesoderm, with gli2 expression extending more laterally (arrows). (C) 5-somite stage. gli1 is expressed throughout the anterior neural plate (white arrowhead), in adaxial cells that give rise to slow muscle fibers (black arrowheads), as well as in the tailbud (out of focus). Some patchy expression is present in the developing spinal cord (arrow). (D) 10-somite stage, dorsal view (left) and cross section (right) of the trunk. gli1 expression continues in adaxial cells (arrowheads) and spreads laterally into developing somites (asterisk). gli1 is expressed ventrally in the spinal cord (larger arrow) but not in floor plate cells adjacent to the notochord (smaller arrow). (E-J) Lateral views of the brain, eyes have been removed. (E) 10-somite stage. gli1 is expressed throughout the ventral forebrain, midbrain, hindbrain, and spinal cord (not shown). (F) 20-somite stage. In the brain, gli1 is expressed in ventral regions in a pattern similar to that of ptc1 (see Fig. 3). In the forebrain, gli1 is primarily expressed in the diencephalon, but expression also extends into the ventral telencephalon dorsal to the optic recess (black dot). Expression is now absent in the ventral-most diencephalon, with the exception of a large patch in the posterior part of the developing hypothalamus (arrow). (G,H) 24 hours and 30 hours. gli1 expression continues in the ventral CNS, including in the pre- and postoptic areas on either side of the optic recess (black dot) and in the patch in the posterior hypothalamus (arrow). (I) Expression in the trunk at 30 hours. gli1 is strongly expressed in the spinal cord (arrows) and is more weakly expressed in somites. Cross section through trunk (right) shows spinal cord gli1 expression (larger arrow) is absent from dorsal cells and ventral floor plate cells (smaller arrow). (J) 36 hours. By 36 hours, gli1 is expressed predominantly along the diencephalon/telencephalon border and in the ventral hypothalamus, including the region of the anterior pituitary anlage (arrowhead). gli1 is also expressed in a small patch in the telencephalon (arrow) and in endoderm (white arrow). (K) Expression in the fin bud at 36 hours. Both gli1 (left) and gli2 (right) are expressed in the pectoral fin buds (arrowheads). gli1 expression is more limited than gli2, being predominantly in the posterior and distal mesenchyme, while gli2 is expressed throughout the fin mesenchyme (compare arrowheads). (A-D) and (K) are dorsal views, (E-J) are lateral views. Anterior is to the left in all panels except (A) and (K), where anterior is up. di; diencephalon, FB; forebrain, HB; hindbrain, hy; hypothalamus, MB; midbrain, MDB; mid-diencephalon boundary, MHB; midbrain-hindbrain boundary, nc; notochord, te; telencephalon.
EXPRESSION / LABELING:
|
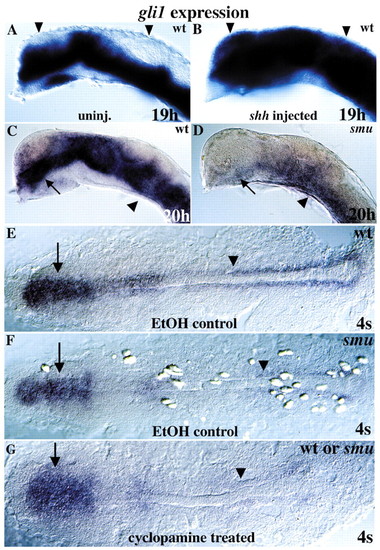
Hh signaling regulates gli1 expression. (A,B) Over expression of shh in wild type expands gli1 expression dorsally throughout the embryo (compare arrowheads). (C,D) gli1 expression is extremely reduced in Hh signaling-defective smu/smo mutant embryos relative to wild-type siblings, especially in the diencephalon (arrows). Some gli1 expression remains in the ventral spinal cord and hindbrain (arrowheads). (E) Dorsal view of wild-type gli1 expression in a 4-somite stage embryo; treated with ethanol (cyclopamine carrier). (F) In 4-somite stage smu/smo mutants, gli1 expression is reduced in adaxial cells (arrowhead) and is less affected in the developing brain (arrows). (G) Similarly, cyclopamine treatment of wild-type or smu/smo embryos reduces but does not eliminate gli1 expression. All 40 cyclopamine-treated embryos from a smu-/+incross showed the same gli1 labeling pattern, indicating that the smu/smo mutation blocks Hh signaling as completely as cyclopamine, and that maternal smu/smo function is not responsible for low level gli1 expression in smu/smo mutant embryos.
EXPRESSION / LABELING:
|
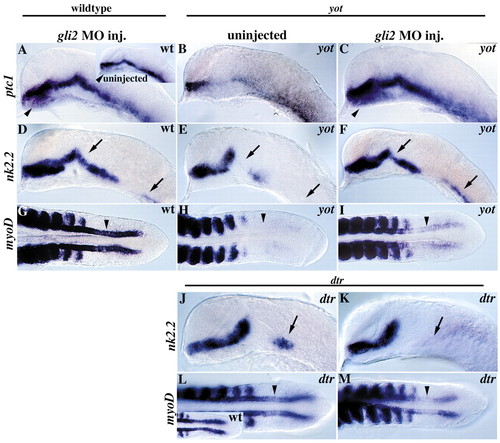
gli2 MO injection rescues nk2.2 and myoD expression defects in yot/gli2 mutants and reveals a weak activator role for Gli2. (A) gli2 MO injection expands ptc1 expression ventrally in the diencephalon (arrowheads) and causes a minor but consistent overall expansion of ptc1 expression (compare to inset). (B) yot/gli2 mutants have significantly reduced ptc1 expression. (C) gli2MO injections rescue the ptc1 defects seen in yot/gli2 mutants and expand ptc1 expression ventrally (arrowhead). (D) Injection of gli2MOs into wild-type embryos has no effect on nk2.2 expression. (E,F) Injection of a gli2MOs into yot–/–mutant embryos can completely rescue yot-induced defects in nk2.2 expression (compare arrows). (G) gli2MO injection does not affect myoD expression in adaxial cells (arrowheads). (H,I) gli2MO injections partially rescue yot-induced defects in adaxial myoD expression (compare arrowheads). (J-M) Injection of 3-10 ng of gli2MO into embryos from a cross between dtr–/+heterozygous parents (25% dtr–/–mutants expected) resulted in an additional loss of nk2.2 expression in the tegmentum (compare arrows in J,K) and a reduction in adaxial myoD expression (compare arrowheads in L,M) in 60/206 embryos (29%), all of which were dtr–/–mutants as judged by forebrain and hindbrain nk2.2 expression defects. This suggests Gli2 may activate Hh signaling in a small area of the ventral midbrain and in adaxial cells. Control MO injections had no effect on nk2.2 expression in 85/85 embryos from a similar dtr–/+x dtr–/+cross, with 25 embryos (29%) showing the dtr–/–nk2.2 defects (J) and 60 embryos (71%) showing wild-type nk2.2 expression as expected for dtr–/+ and dtr+/+embryos. (A-F,J, and K) are lateral views of the head, eyes removed. (G-I,L, and M) are dorsal views of the tail region. All embryos are at the 20 somite (19 hour) stage. For yot/gli2, embryo genotypes were inferred by myoD expression in adaxial cells, then were verified by PCR (not shown, see Materials and Methods). D and G, E and H, F and I, J and L and K and M show the same individual labeled simultaneously with nk2.2 and myoD.
EXPRESSION / LABELING:
|
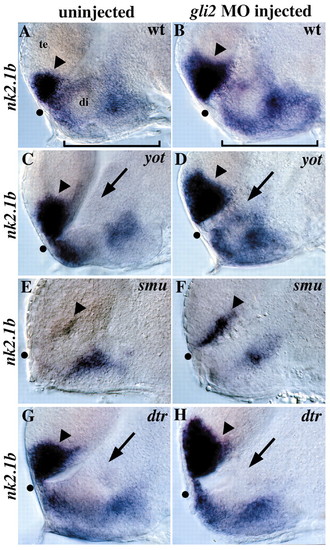
Regulation of nk2.1b by gli2, yot/gli2, smu/smo and dtr/gli1. (A) nk2.1b is normally expressed in the anterior/ventral telencephalon (arrowhead) and in the diencephalon (bracket). (B) gli2MO injection into wild-type embryos leads to a dorsal expansion of telencephalic nk2.1b expression (arrowhead), as well as an increase in expression in the hypothalamus (compare brackets). This expansion was seen in 70/72 wild-type embryos injected with 10 ng of gli 2MO. (C) yot–/–embryos have reduced nk2.1b expression in the diencephalon adjacent to the first ventricle (arrow). (D) gli2 MO injection into yot–/–embryos rescues the diencephalic nk2.1b expression defect (compare arrows in C and D, Table 2), and also leads to expanded expression in the telencephalon (compare arrowheads). (E) nk2.1b expression is extremely reduced in smu/smo mutants, with small patches of expression remaining in the diencephalon and telencephalon (arrowhead). (F) Injection of 10 ng of gli2 MO into embryos from a cross of two smu+/–parents resulted in telencephalic nk2.1b expansion (arrowhead) in 89/89 embryos, including 18 smu–/–embryos (20%) and 71 wild-type and heterozygous siblings (80%). This shows that Gli2 repression of this Hh target gene is independent of Hh signaling. No nk2.1b expansion was detected in 49/49 embryos injected with 10 ng of control MO. (G) dtr–/–embryos have reduced nk2.1b expression in the diencephalon adjacent to the first ventricle (arrow) similar to the yot/gli2 phenotype. (H) gli2 MO injection does not rescue diencephalic nk2.1b expression in dtr/gli1 mutants, but does expand nk2.1b expression in the telencephalon (arrowhead). Injection of 3-7 ng of gli2 MO resulted in telencephalic nk2.1b expansion in 64/64 embryos, including 6 embryos (10%) that were clearly homozygous dtr–/–mutants based on diencephalic nk2.1b defects. The remaining 58 siblings (90%) also had expanded telencephalic nk2.1b expression. All panels show 30-hour embryos, lateral views of the forebrain, eyes removed, anterior to the left. All panel pairs show sibling embryos from the same experiment. Dot shows the optic recess, the anterior edge of the border between the diencephalon (di) and telencephalon (te).
EXPRESSION / LABELING:
|