
- Title
-
Deletion of the chd7 Hinders Oligodendrocyte Progenitor Cell Development and Myelination in Zebrafish
- Authors
- Shi, L., Wang, Z., Li, Y., Song, Z., Yin, W., Hu, B.
- Source
- Full text @ Int. J. Mol. Sci.
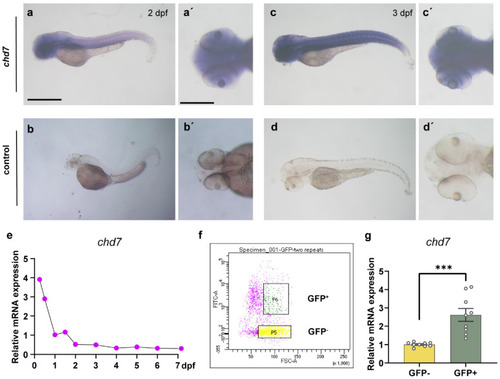
The expression pattern of chd7 at the early stage. (a–d) Zebrafish at 2–3 dpf using WISH displaying high expression of chd7 in the brain, eyes and spinal cord (lateral view). (a’–d’) Dorsal view of the brain. All embryos shown in both the lateral and dorsal view. Scale bar in (a–d), 10 μm; Scale bar in (a’–d’), 5 μm. (e) Q-PCR results showed that chd7 mRNA expression begins at 6 hpf and decreases gradually thereafter. (f) Representative image of FACS analysis of olig2+ cells and olig2− cells from the Tg (olig2: EGFP) line. (g) Real-time Q-PCR results of olig2+ cells and olig2− cells. Data shown as mean ± sem. *** p = 0.0003, unpaired Student’s two-tailed t-test. |
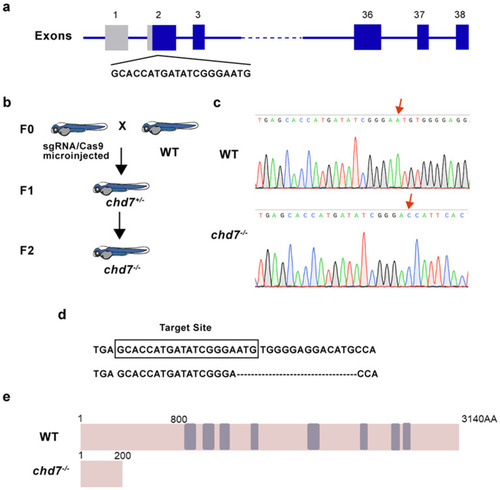
Identification of chd7 knockout zebrafish. (a) Schematic of the Cas9-sgRNA targeted site located in the first exon of chd7. (b) After crossbreeding and self-crossing, homozygous mutant strains were obtained. F0: sgRNA/Cas9 microinjected zebrafish was mated with WT zebrafish; F1: the heterozygous descendant of F0, which have the same type of mutation; F2: homozygous descendant of F1. (c,d) Sequencing results showed that 16 bp were deleted in the chd7−/− zebrafish. (e) Schematic of the protein sequence showed that CHD7 mutated zebrafish expressed truncated CHD7 composed of 200 amino acids, while wild-type CHD7 is composed of 3140 amino acids. |
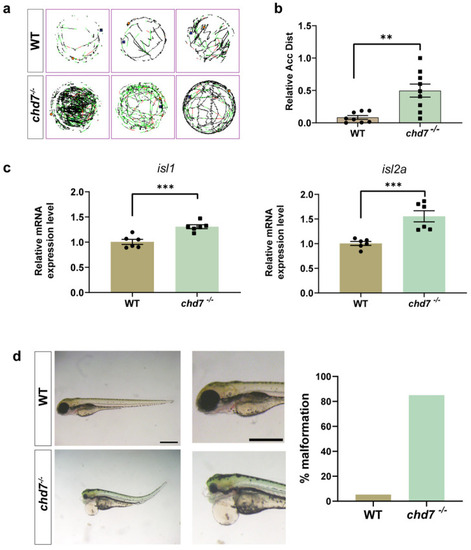
Knockout of chd7 caused developmental behavioral defects. (a,b) The line illustrates the 6 dpf zebrafish larvae’s swimming trajectory differences from the WT and chd7−/− groups evaluated over 1 h. ** p = 0.0021, unpaired Student’s two-tailed t-test. (c) Real-time Q-PCR results of motor neuron marker genes isl1 (*** p = 0.0007) and isl2a (*** p = 0.001). Data were shown as mean ± sem. unpaired Student’s two-tailed t-test. (d) Representative morphological image of embryos and analysis of malformation rate from the WT and chd7−/− groups at 3 dpf. Scale bar: 100 μm. EXPRESSION / LABELING:
PHENOTYPE:
|
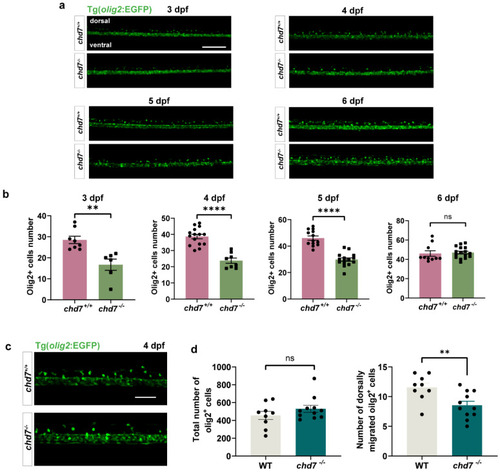
Chd7 knockout suppressed OPC migration. (a) Representative image of dorsally migrated olig2+ cells at 3, 4, 5, and 6 dpf between chd7+/+ and chd7−/− groups. Scale bar: 100 μm. (b) The number of dorsally migrated olig2+ cells at 3, 4, 5, and 6 dpf decreased in chd7−/− group. Data shown as mean ± sem. 3 dpf, ** p = 0.0023; 4 dpf, **** p < 0.0001; 5 dpf, **** p < 0.0001; 6 dpf, p = 0.7349, ns: not significant, unpaired Student’s two-tailed t-test. (c) Representative image of total and dorsally migrated olig2+ cells at 4 dpf between chd7+/+ and chd7−/− group. Scale bar: 10 μm. (d) The number of total olig2+ cells at 4 dpf did not differ significantly between the two groups, ns: not significant. The number of dorsally migrated olig2+ cells at 4 dpf decreased in chd7−/− group. ** p = 0.0075, unpaired Student’s two-tailed t-test. EXPRESSION / LABELING:
PHENOTYPE:
|
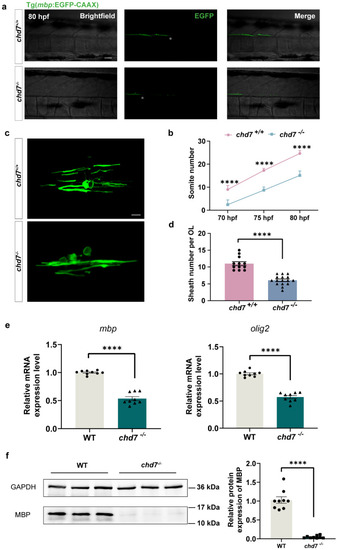
Chd7 knockout mutant affected the myelin potential of OL. (a) The most posterior myelin sheath in the spinal cord at 80 hpf during myelination of the Mauthner axon between chd7+/+ and chd7−/− groups. Asterisks represent the terminals of myelin-coated axons. Scale bars:100 μm. (b) The most posterior myelin sheath at 70 hpf was somite 9 in the wild-type and somite 2 in mutant groups; at 75 hpf was somite 17 in the wild-type and somite 9 in mutant groups; and at 80 hpf was somite 25 in the wild-type and somite 15 in mutant groups. (c) Typical confocal imaging of individual oligodendrocytes labeled with plasmid mbp-EGFP-CAAX in the wild-type and mutant groups. Scale bar: 50 μm. (d) Number of individual oligodendrocyte-wrapped myelin segments in the wild-type and mutant groups. Wild type: 12 cells derived from 10 juveniles; mutant group: 16 cells derived from 9 juveniles. (e) Real-time Q-PCR results of gene olig2 and mbp. (f) Protein MBP was decreased in knockout group as shown by Western blot quantification. Data were shown as mean ± sem. **** p < 0.0001, unpaired Student’s two-tailed t-test. EXPRESSION / LABELING:
PHENOTYPE:
|

Deficiency of chd7 lowered the quality of myelin sheath. (a) Transmission electron micrograph of the axons of Mauthner cells in the WT and KO groups of 5 dpf zebrafish larvae. Scale bars: 500 nm. (b) Transmission electron micrograph of other ventral axons in the WT and KO groups of 5 dpf zebrafish larvae, with yellow arrows indicating myelinated axons and red arrows indicating unmyelinated axons. Scale bars: 2 μm. (c,d) Myelin thickness analysis of Mauthner cells and other ventral axons. Compared with the WT group, both Mauthner cells and other ventral axons in the KO group had a higher ratio, implying thinner myelin sheaths. Data shown as mean ± sem. unpaired Student’s two-tailed t-test, * p < 0.05, **** p < 0.0001. PHENOTYPE:
|
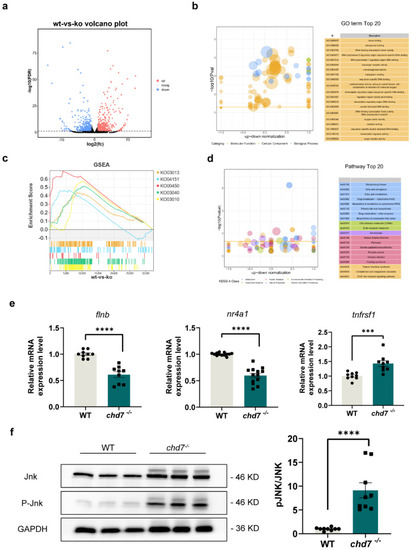
Chd7 may regulate myelin development via the MAPK pathway. (a) Volcano plot showing each gene plotted according to its log2 fold change. All highly differentially expressed genes with p < 0.05 are in orange with fold change > 1.5. In total, 589 genes were significantly up-regulated and 438 genes were significantly down-regulated. (b) Gene ontology showing the 20 most significant functional classifications for differential gene enrichment. (c) Gene set enrichment analysis determining the significantly down-regulated pathway activity in the chd7 knockout group. (d) Kyoto Encyclopedia of Genes and Genomes analysis determining the top 20 enriched pathways of the differentially expressed genes. (e) Real-time Q-PCR results showed that the target genes of protein CHD7 are significantly changed in expression after chd7 KO. (f) JNK activation via phosphorylation was increased in knockout group as shown via Western blot quantification. Data shown as mean ± sem. unpaired Student’s two-tailed t-test, *** p = 0.001, **** p < 0.0001. EXPRESSION / LABELING:
PHENOTYPE:
|