FIGURE SUMMARY
Title

Photoactivatable metabolic warheads enable precise and safe ablation of target cells in vivo

Authors
Benson, S., de Moliner, F., Fernandez, A., Kuru, E., Asiimwe, N.L., Lee, J.S., Hamilton, L., Sieger, D., Bravo, I.R., Elliot, A.M., Feng, Y., Vendrell, M.
Source
Full text @ Nat. Commun.

Synthetic routes for the preparation of small photosensitizers.

a Condensation of 1 with PhNSO or SeO2 followed by nitration led to compounds 3 and 4F, respectively. Reduction of 4F followed by Cu-catalyzed addition of acetone rendered compound 5. Nucleophilic substitutions of 25 with diethylamine yielded 2a5a. b Human U87 cells were incubated with 2a5a (100 μM) in Krebs–Ringer buffer and illuminated (red bars) or not (gray bars) with a ThorLabs M530L3 LED (10 mW, 37 J cm−2, red). Cell viability was assessed 16 h post illumination using a TACSR MTT cell proliferation assay with values normalized to the viability of untreated cells. Data presented as mean values ± SEM (n = 3 independent experiments). c Nucleophilic substitution of 4F with piperidine, 4-methoxyphenol, and 4-mehtoxythiophenol led to compounds 6, 7, and 8, respectively. Suzuki coupling of 4Cl with methoxybenzene-4-boronic acid rendered compound 9. Condensation of compound 10 with SeO2 followed by nitration and nucleophilic substitution resulted in compound 11a. d Maximum excitation wavelengths and phototoxicity of compounds 2a11a and 4F in human cells as determined in (b). Values indicate the decrease in viability between irradiated and non-irradiated cells after incubation with compounds 2a11a (100 μM). P values were obtained from two-tailed unpaired t tests. Source data are available.

Benzoselenadiazole D-amino acids can be incorporated into bacteria for light-controlled antimicrobial ablation.

ad-alanine is incorporated into the positions 4 or 5 of peptidoglycan structures. Incorporation followed by illumination results in the production of singlet oxygen and concomitant cell death (Gln: N-acetylglucosamine, Mur: N-acetylmuramic acid). b Synthesis of the amino acids 12 and 13 by conjugation of 4F with enantiomers of 2,3-diaminoproprionic acid. c Brightfield and fluorescence microscopy images of E. coli after incubation with compounds 12 and 13 (250 μM). Scale bar: 10 μm. The viability of bacterial cells was measured by optical density (600 nm) after incubation at 30 °C with or without compounds 12 or 13 and illumination using white LED. Data normalized to the viability of light-only treated cells and presented as mean values ± SEM (n = 2 independent experiments). d Time-lapse monitoring of E. coli that had been pretreated with NADA or compound 13 (both 100 μM). Representative brightfield and fluorescence microscope images (from three independent experiments) with excitation at 470 nm (196 mW) and 508 nm (62 mW) were taken every minute for 30 min. Green and red arrows indicate NADA- and 13-labeled bacteria, respectively; yellow arrowheads indicate exploding 13-labeled bacterial cells after treatment. Scale bar: 2 μm. Source data are available.

<sc>d</sc>-Glucose derivatives of benzoselenadiazole — but not of other photosensitizers—are recognized by GLUT transporters.

a Chemical synthesis of the d-glucose aminobenzodiazole compounds 14 and 15, and the non-photosensitive control compound 2-NBDG. b Structures of d-glucose derivatives of the photosensitizers Nile Blue (compound 16) and tetraphenylethylene (TPE, compound 17). Full synthetic and characterization details described in the Supplementary Information. c Flow cytometric quantification (gating: Supplementary Fig. 5) of uptake of d-glucose derivatives in human U87 cells (200,000 cells/well) after incubation for 1 h with compounds 1517 (50–100 μM) in Krebs–Ringer buffer in the presence or not of the GLUT inhibitor cytochalasin B (20 μM) (λexc/em 488/610 nm (15), 635/670 nm (16), 355/450 nm (17)). Phototoxicity in U87 cells after incubation with compound 15 (100 μM) in the presence or absence of cytochalasin B (20 μM). Cells were illuminated (10 mW, 37 J cm−2) and viability was assessed 16 h post illumination using a TACSR MTT cell proliferation assay with values normalized to those in cells without cytochalasin B. Data presented as mean values ± SEM (n = 3 independent experiments). d Excitation wavelengths used for single-photon illumination (*corresponds to two-photon illumination) and singlet oxygen generation quantum yields determined using DPBF in EtOH (Note: DPBF was found insoluble in water) using Rose Bengal as a reference (68%)61. Singlet oxygen generation quantum yield reported for TPE62. ¥Reported values for protoporphyrin IX, the main photosensitizer produced upon metabolism of 5-aminolevulinic acid (5-ALA)63. P values were obtained from two-tailed unpaired t tests. Source data are available.

Compound 15 kills metabolically-active human glioblastoma cells in vitro and in 3D structures.

a Representative brightfield and fluorescence images (from three independent experiments) of U87 human glioblastoma cells (20,000 cells/well) treated with compound 15 (red, λem 590 nm) or 2-NBDG (green, λem 530 nm) (both 100 μM) with or without d-glucose (5 mM) and illuminated or not with ThorLabs M530L3 LED (10 mW, 37 J cm−2). Annexin V-Pacific blue (4 μg mL−1) was used as an apoptosis marker (blue, λem 450 nm). Scale bar: 10 μm. b Flow cytometric quantification (gating: Supplementary Fig. 5) of apoptotic U87 cells after different treatments. Data presented as mean values ± SD (n = 4 independent experiments). c Size decrease of U87-nlsCrimson 3D spheroids after variable treatments with compound 15 (100 μM) and visible light (10 mW, 37 J cm−2). Data presented as mean values ± SEM and normalized to the viability of untreated spheroids (n = 3 independent experiments with three technical replicates). d Representative merged brightfield and fluorescence microscope images (from three independent experiments) of U87-nlsCrimson spheroids where live cells expressed E2Crimson fluorescent protein (λem 645 nm, magenta). Spheroids treated with compound 15 plus light showed circumference of dead cells of ~50 μm in diameter (blue bar). Scale bar: 100 μm. P values were obtained from two-tailed unpaired t tests. Source data are available.

Compound 15 selectively ablates human glioblastoma cancer cells under clinical PDT conditions and in the presence of non-cancerous human brain cells.

a Procedure for coculturing human non-cancerous brain HCN-2 cells (stained with CellMask Green) and human glioblastoma U87-nlsCrimson cells. Cocultures (15,000 HCN-2 cells and 10,000 U87 cells per well) were incubated with compound 15 (100 μM) and illuminated with ThorLabs M530L3 LED (37 J cm−2). The fluorescence emission from E2Crimson is reduced in U87-nlsCrimson glioblastoma cells upon cell death. (b, c) Representative brightfield and fluorescent confocal microscopy images (from three independent experiments) of cocultured HCN-2 (green, λem: 520 nm) and U87-nlsCrimson (magenta, λem: 645 nm) before (b) and after treatment (c). Yellow arrowheads in (c) highlight dead U87h cells devoid of Crimson fluorescence. Scale bars: 10 μm. d Phototoxicity analysis under different concentrations of compound 15 and 5-ALA in U87 glioblastoma cells (20,000 cells/well) using the same irradiation settings (10 mW, 37 J cm−2). Data presented as mean values ± SEM (n = 3 independent experiments). e HCN-2 cell viability (10,000 cells/well) after incubation with concentrations under the phototoxicity threshold [i.e., compound 15 (100 μM, red) and 5-ALA (200 μM, blue)] and light exposure (37 J cm−2). Data presented as mean values ± SEM (n = 4 independent experiments). Source data are available.

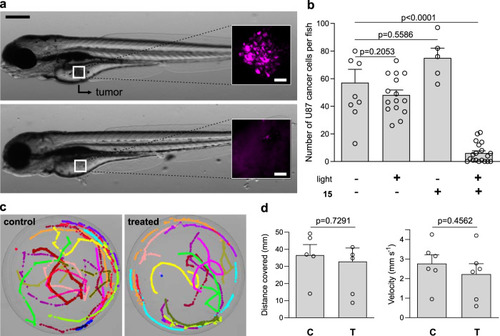
a Representative brightfield microscopy images (from five independent experiments) of zebrafish larvae grafted with U87-nlsCrimson cells before treatment (top) and after the injection of compound 15 (6 pg per embryo) and light irradiation (37 J cm−2, bottom). Insets show fluorescence microscopy images (λexc/em: 561/645 nm) of microtumors formed by U87-nlsCrimson cells, which are fully eliminated after treatment. Scale bars: 50 µm (brightfield), 20 µm (fluorescence). b Quantification of fluorescent U87-nlsCrimson cells remaining in zebrafish larvae under different treatments. Data presented as means ± SEM (n = 5 independent experiments). c Microscope images of superimposed pseudo-colored swimming tracks of control untreated zebrafish larvae and double-treated (compound 15 plus light) larvae (n = 5 per group, representative videos for each group shown as Supplementary Movies 1 and 2). d Quantification of distance and velocity of control untreated zebrafish larvae (C) and double-treated zebrafish larvae (i.e., compound 15 plus light, T) larvae. Data presented as mean values ± SEM (n = 5 independent experiments). P values were obtained from one-way ANOVA with multiple comparisons in (b) and two-tailed unpaired t tests in (d). Source data are available.

Acknowledgments
This image is the copyrighted work of the attributed author or publisher, and ZFIN has permission only to display this image to its users. Additional permissions should be obtained from the applicable author or publisher of the image. Full text @ Nat. Commun.