
- Title
-
Phylogenetic and developmental analyses indicate complex functions of Calcium-Activated Potassium Channels in zebrafish embryonic development
- Authors
- Silic, M.R., Black, M.M., Zhang, G.
- Source
- Full text @ Dev. Dyn.

The kcnn1 gene (SK) was duplicated in zebrafish and teleosts. A, Maximum likelihood phylogeny of zebrafish, human, and mouse KCNN genes. Two zebrafish kcnn1 genes were grouped with human and mouse KCNN1 genes. Branch lengths are proportional to expected replacements per site. B, Maximum likelihood phylogeny of vertebrate KCNN1 proteins with representative vertebrate species. In addition to zebrafish, all analyzed teleost species also have two kcnn1a genes. Both phylogenetic trees were inferred with JTT model plus gamma distances using PhyML program. Numbers around each node indicate bootstrap values based on 1000 replicates |
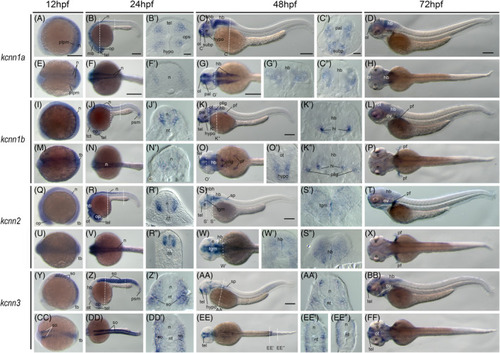
Gene expression of small‐conductance calcium‐activated potassium channel genes in early zebrafish embryos. Whole‐mount in situ hybridization of zebrafish embryos at stages 12hpf (A, E, I, M, Q, U, Y, CC), 24hpf (B, F, J, N, R, V, Z, DD), 48hpf (C, G, K, O, S, W, AA, EE), and 72hpf (D, H, L, P, T, X, BB, FF). Anterior is to the left in all the whole‐mount images, and dorsal is to the top in all transverse sections. Each embryo was imaged from the lateral and dorsal perspective, respectively. A‐D, Lateral view of gene expression of kcnn1a. E‐H, Dorsal view of gene expression of kcnn1a. I‐L, Lateral view of gene expression of kcnn1b. M‐P, Dorsal view of gene expression of kcnn1b. Q‐T, Lateral view of gene expression of kcnn2. U‐X, Dorsal view of gene expression of kcnn2. Y‐BB, Lateral view of gene expression of kcnn3. CC‐FF, Dorsal view of gene expression of kcnn3. The dashed lines indicate the approximate positions of sections. The letters below or around the dashed lines correspond to the section panels. Scale bars are added on the top row of images; 250 μm for whole mount images and 50 μm for tissue sections. e, eye; hb, hind brain; hi, intermediate hypothalamus, hypo, hypothalamus; mb, midbrain; mhb, midbrain‐hindbrain boundary; n, neural tube; nt, notochord; ol, olfactory placodes/organ; op, optic vesicle; ot, optic tectum; ov, otic vesicle; pal, pallium; pf, pectoral fin; pllg, posterior lateral line ganglia; plpm, posterior lateral plate mesoderm; psm, presomitic mesoderm; so, somite; sp, spinal cord; subp, subpallium; tb, tailbud; tel, telencephalon; tgm, tegmentum EXPRESSION / LABELING:
|
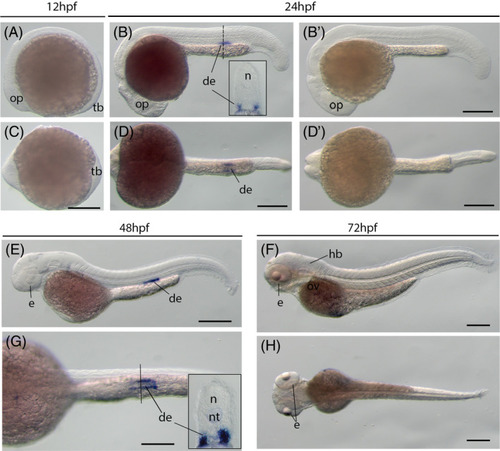
The kcnn4 gene (IK) expression during zebrafish early embryogenesis. Whole‐mount in situ hybridization of zebrafish embryos at stages 12hpf (A,C), 24hpf (B,B′,D,D′), 48hpf (E,G), and 72hpf (F,H). B′ and D′: sense probe controls. Anterior is to the left in all the whole‐mount images, and dorsal is to the top in all transverse sections. A‐D, Lateral view of gene expression of kcnn4. E‐H, Dorsal view of gene expression of kcnn4. The dashed lines indicate the approximate positions of sections. The section images were shown in the insert of corresponding panels. Scale bars: 250 μm for whole mount images. de, distal early tube of the nephric duct; e, eye; hb, hindbrain; n, neural tube; nt, notochord; op, optic vesicle; ov, otic vesicle; tb, tail bud EXPRESSION / LABELING:
|

The kcnma1 gene (BK) was duplicated in zebrafish and teleosts. A, Molecular phylogenetic tree generated using ML analysis on vertebrate KCNMA1 proteins as obtained with JTT model plus gamma distribution. Numbers at each node denote bootstrap values based on 1000 replicates. Branch lengths are proportional to expected replacements per site. The tree is rooted with the shark kcnma1 sequence. B, The syntenies of KCNMA1 in four representative vertebrate species. The illustration of the gene and their sizes are not proportional to the length of the distances between genes. KCNMA1 is highlighted in red. The conserved synteny (DLG5‐KCNMA1‐IRMDA‐ZNF503‐COMTD1) is boxed with dashed lines |
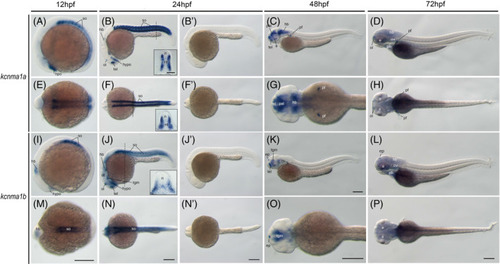
The kcnma1 genes (BK) during zebrafish early embryogenesis. Whole‐mount in situ hybridization of zebrafish embryos at stages 12hpf (A,E,I,M), 24hpf (B,F,J,N,B′,F′,J′,N′), 48hpf (C, G, K, O), and 72hpf (D, H, L, P). Sense riboprobe controls (B′,F′,J′,N′) do not show any specific staining at 24hpf. Anterior is to the left in all the whole‐mount images, and dorsal is to the top in all transverse sections. The dashed lines indicate the positions of sections. The section images were shown in the insert of corresponding panels. A‐D, Lateral view of gene expression of kcnma1a. E‐H, Dorsal view of gene expression of kcnma1a. I‐L, Lateral view of gene expression of kcnma1b. M‐P, Dorsal view of gene expression of kcnma1b. Scale bars are added on the bottom row of images; 250 μm for whole‐mount images and 50 μm for tissue sections. e, eye; ep, epiphysis; hb, hindbrain; hypo, hypothalamus; n, neural tube; nt, notochord; ol, olfactory placodes/organ; op, optic vesicle; ot, optic tectum; ov, otic vesicle; pal, pallium; pf, pectoral fin; ph, pharyngeal arches; so, somite; tb, tailbud; tel, telencephalon; tgm, tegmentum EXPRESSION / LABELING:
|

Zebrafish beta unit genes were duplicated. A, Molecular phylogenetic tree generated using ML analysis on vertebrate KCNMB proteins as obtained with JTT model plus gamma distribution. Numbers at each node denote bootstrap values based on 1000 replicates. Branch lengths are proportional to expected replacements per site. Each protein forms a distinct clade. B, The synteny of KCNMB1 in four representative vertebrate species. The illustration of the genes and their sizes are not proportional to the length of the distances between genes. KCNMB2 is highlighted in red. The conserved synteny (KCNMB2‐ZMAT3‐PIK3CA‐KCNMB3‐MFN1‐GNB4‐ACTL6A) is boxed with dashed lines. The zebrafish kcnmb2a is still linked with kcnmb3 |

Zebrafish beta unit gene expression patterns during early embryogenesis. Whole‐mount in situ hybridization of zebrafish embryos at stages 12hpf (A,E,I,M,Q,U), 24hpf (B,F,J,N,R,V), 48hpf (C,G,K,O,S,W), and 72hpf (D,H,L,P,T,X). Anterior is to the left in all the whole‐mount images, and dorsal is to the top in all transverse sections. Each embryo was imaged laterally and dorsally, respectively. A‐D, Lateral view of gene expression of kcnmb2a. E‐H, Dorsal view of gene expression of kcnmb2a. I‐L, Lateral view of gene expression of kcnm2b. M‐P, Dorsal view of gene expression of kcnm2b. Q‐T. Lateral view of gene expression of kcnmb3. U‐X. Dorsal view of gene expression of kcnmb3. The dashed lines indicate the approximate positions of sections. The letters below or around the dashed lines correspond to the panels. Scale bars are added on the top row of images; 250 μm for whole mount images and 50 μm for tissue sections. e, eye; hb, hindbrain; n, neural tube; nt, notochord; op, optic vesicle; ot, optic tectum; ov, otic vesicle; pf, pectoral fin; ph, pharyngeal arch; so, somite; tb, tailbud EXPRESSION / LABELING:
|

Maximum likelihood phylogenetic analysis of vertebrate KCNT proteins. Molecular phylogenetic tree generated using ML analysis on vertebrate KCNT proteins as obtained with JTT model plus gamma distribution. Numbers at each node denote bootstrap values based on 1000 replicates. Branch lengths are proportional to expected replacements per site. Each protein forms a distinct clade. The dashed lines indicate a long‐branch of the zebrafish Kcnt2a. Teleost species possess both Kcnt1 and Kcnt2 proteins |

Gene expression patterns of the zebrafish kcnt genes. Whole‐mount in situ hybridization of zebrafish embryos at stages 12hpf (A, E, I, M, Q, U, Y, CC), 24hpf (B, F, J, N, R, V, Z, DD), 48hpf (C, G, K, O, S, W, AA, EE), and 72hpf (D, H, L, P, T, X, BB, FF). Anterior is to the left in all the whole‐mount images, and dorsal is to the top in all transverse sections, except panel B′ and B″. Each embryo was imaged laterally and dorsally, respectively. A‐D, Lateral view of gene expression of kcnt1a. E‐H, Dorsal view of gene expression of kcnt1a. I‐L. Lateral view of gene expression of kcnt1b. M‐P, Dorsal view of gene expression of kcnt1b. Q‐T, Lateral view of gene expression of kcnt2a. U‐X, Dorsal view of gene expression of kcnt2a. Y‐BB, Lateral view of gene expression of kcnt2b. CC‐FF, Dorsal view of gene expression of kcnt2b. The dashed lines indicate the approximate positions of sections. The letters below or around the dashed lines correspond to the panels. Scale bars are added on the top row of images; 250 μm for whole mount images and 50 μm for tissue sections. e, eye; hb, hindbrain; hypo, hypothalamus; kv, Kupffer's vesicle; n, neural tube; nn, neural nucleus; nt, notochord; ol, olfactory placodes/organ; op, optic vesicle; ov, otic vesicle; pal, pallium; ptc,, posterior tuberculum; rhb, rohon beard neurons; subp, subpallium; tb, tailbud; th, thalamus; tgm, tegmentum EXPRESSION / LABELING:
|

Model of vertebrate KCa genes' evolutionary history. The phylogenetic relationships of vertebrata are based on our col2a1 and kank genes' phylogenetic analyses. 23 , 53 , 54 The branch lengths are not proportional to the time of diversification. The two vertical dark blue bars on the tree indicate the WGD events (R1 and R2) at the origin of the vertebrates. The light blue vertical bar represents the teleost specific WGD. The process of gene duplication and diversification through WGD is illustrated by the brown bars on the far‐right side of the illustration. The representative KCa genes present in the vertebrates that are listed on the right side of these taxa. The presence of these genes may be variable in specific species, as exemplified by the loss of kcnmb4 in zebrafish, but not in other teleost species |