
- Title
-
Coevolution of enamel, ganoin, enameloid, and their matrix SCPP genes in osteichthyans
- Authors
- Kawasaki, K., Keating, J.N., Nakatomi, M., Welten, M., Mikami, M., Sasagawa, I., Puttick, M.N., Donoghue, P.C.J., Ishiyama, M.
- Source
- Full text @ iScience
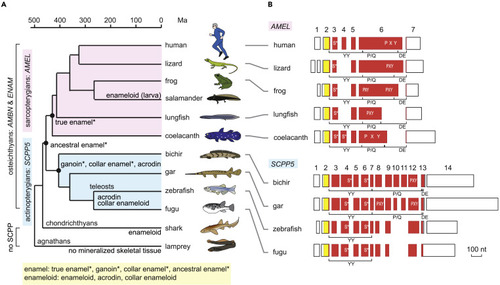
(A) Phylogenetic distribution of enamel, enameloid, and their matrix genes. Hypermineralized tissues classified as enamel are denoted by an asterisk. Divergence times are based on previous studies: most sarcopterygian taxa (Hedges and Kumar, 2009), actinopterygian taxa (Near et al., 2012), lungfish-tetrapods and chondrichthyans-osteichthyans (Giles et al., 2017), and agnathans-gnathostomes (Kuraku and Kuratani, 2006). (B) Exon-intron structure of AMEL and SCPP5. Separate boxes represent exons. Open areas in exons show 5′ and 3′ untranslated regions. The areas encoding the signal peptide and mature protein are shown in yellow and vermilion, respectively. Exon numbers are indicated for human AMEL (AMELX) and bichir scpp5. Locations encoding phospho-Ser residues (S∗) (Kawasaki and Amemiya, 2014) and Pro-Xaa-Yaa (Xaa and Yaa represent any amino acids; PXY) repeats are illustrated within exon boxes. Regions encoding the three modules, the N-terminal aromatic residue-rich region (YY), the Pro/Gln-rich core region containing uninterrupted PXY repeats (P/Q), and the C-terminal hydrophilic region (DE), are indicated below exon boxes. Scale bar, 100 nucleotides (nt). See Figure S1A for details. |

(A) Hematoxylin-eosin (H&E) staining of a developing gar tooth immediately after acrodin formation. Scale bar, 50 μm. (B–D) Our in situ hybridization (ISH) analysis reveals expression of gar ambn (B), enam (C), and scpp5 (D) in IDE cells during the matrix formation stage of acrodin formation (closed arrowheads). (E) H&E staining of a developing gar tooth forming collar enamel. Scale bar, 50 μm. (F–H) ISH analysis reveals expression of gar ambn (F), enam (G), and scpp5 (H) in IDE cells during the secretory stage of collar enamel formation (closed arrowheads). (I) H&E staining of a gar scale forming ganoin. Ganoin was lost during decalcification. Scale bar, 50 μm. (J–L) ISH analysis reveals expression of gar ambn (J), enam (K), and scpp5 (L) in IGE cells during the secretory stage of ganoin formation (closed arrowheads). Brown pigments are shown by asterisks. (M) H&E staining of a developing zebrafish tooth. Scale bar, 50 μm. (N and O) ISH analysis reveals expression of zebrafish ambn (N) in IDE cells (a closed arrowhead) and enam (O) in matrix-formation stage IDE cells and odontoblasts (closed arrowheads). (P) Summary of matrix SCPP gene expression in mineralized tissues. In gar scales, relative expression levels were determined by RNA-seq analysis (Table S1) and the highest expression level of scpp5 among all SCPP genes is shown as “++.” Expression of zebrafish scpp5 (Kawasaki et al., 2017) and stages of hypermineralized tissue formation in gar and teleosts were described previously (Sasagawa, 1995, 1997; Sasagawa and Ishiyama, 2005; Sasagawa et al., 2008, 2013). See Figure S2A for negative controls and more results. Abbreviations: acr, acrodin; bo, bone; cem, collar enamel; de, dentine; ga, ganoin; ide, inner dental epithelial cells; ige, inner ganoin epithelial cells; od, odontoblasts. EXPRESSION / LABELING:
|

(A–F) Optical IHC analysis of gar Scpp5 in acrodin (A and B) and collar enamel (C and D) in teeth, and ganoin in a scale (E and F). The rectangular region in (A), (C), and (E) is enlarged in (B), (D), and (F), respectively. IHC signals in (A), (C), and (E) are shown by closed arrowheads. Vertical lines in the ganoin layer (E and F) are artifacts of sectioning. See the legend of Figure 2 for abbreviations. Scale bar, 100 μm (A and C) or 20 μm (E). The contrast of these images was enhanced uniformly over the entire field (see Figure S2B for original images). |
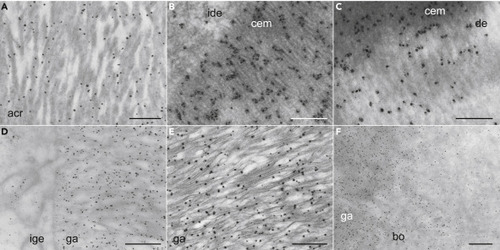
(A–F) TEM IHC analysis of gar Scpp5 in acrodin (A), collar enamel near IDE cells (B), collar enamel near dentine (C), ganoin near IGE cells (D), a middle portion of ganoin (E), and ganoin near bone (F). Dark dots show the distribution of Scpp5. Scale bar, 500 nm (A, D, E, and F) or 200 nm (B and C). See the legend of Figure 2 for abbreviations and Figure S2C for negative controls. |
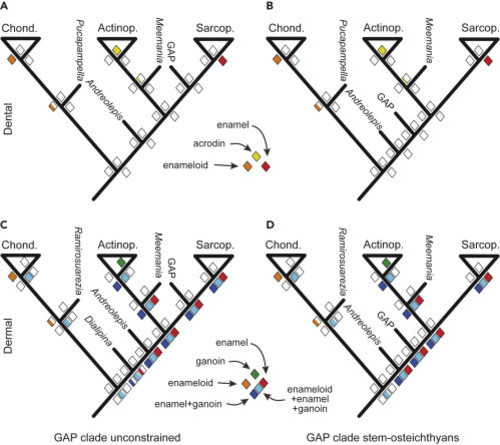
(A–D) Ancestral state reconstruction of the presence of hypermineralized tissues in the dental (A and B) and dermal (C and D) skeletons for trees, in which the GAP clade is resolved through unconstrained analysis to a stem-sarcopterygian affinity (A and C), or constrained to a stem-osteichthyan affinity (B and D). Diamonds at nodes express probability of the presence of a specific hypermineralized tissue, with the proportion of the color fill reflecting probability. The crown-chondrichthyans (Chond.), crown-actinopterygians (Actinop.), and crown-sarcopterygians (Sarcop.) are shown as triangles, and important stem taxa by bars (e.g., Meemannia). Tables S2 and S3 show data used to construct these trees. |