
- Title
-
Grk5l Controls Heart Development by Limiting mTOR Signaling during Symmetry Breaking
- Authors
- Burkhalter, M.D., Fralish, G.B., Premont, R.T., Caron, M.G., and Philipp, M.
- Source
- Full text @ Cell Rep.

Grk5l KD in Zebrafish Affects Early Heart Development (A–A3) Grk5l MO prevents translation of coinjected RNA coding for Grk5l-GFP fused to parts of its 52 UTR and results in fish that show no glowing (A3), whereas RNA injection alone (A) or in combination with the CTRL MO (A2) produces strong GFP expression. (B–B 3) Zebrafish embryos (24 hpf) injected with Grk5l MO (B3) compared with NI embryos (B) and embryos injected with CTRL MO (B2). (C–C 3) Live embryos (96 hpf). Arrow indicates pericaridac edema in Grk5l morphants. (D) Bar graph displaying the percentage of embryos with pericardiac edema as mean ± SEM. n = 3–10 experiments, 76–340 embryos. CTRL MO versus Grk5l MO: p = 0.0023; CTRL MO versus Grk5l MO2: p = 0.0016; CTRL MO versus Grk5l MO3: p = 0.0213. (E) grk5l transcripts in the heart of 48 hpf zebrafish embryos (arrow and higher magnification). (F and F′) bmp4 transcripts are upregulated and dispersed throughout the heart of Grk5l morphants (F′). n = 10–35. (G and G2) Upregulation of cspg2a upon injection of Grk5l MO (G2). n = 16–18. (H and H2) Illustration of normal distribution of bmp4 in controls (H) and widespread expression in Grk5l morphants (H2). (I and I2) Cartoon showing both regular and aberrant distribution of cspg2a in controls (I) and Grk5l MO (I′) injected fish. (J and J2) Notch1b fails to accumulate in the future valve region upon Grk5l KD (J2). n = 16–25. (K and K2) Kdr is strongly upregulated upon KD of Grk5l (K2) compared with control fish (K). n = 5–22. (L and L2) Ventricular fate as shown by WMISH for vmhc is properly established when Grk5l is lost. n = 27–32. (M and M2) Amhc expression in the atrium. n = 18–23. (N) WMISH for cmlc2 at 50 hpf, revealing altered cardiac looping in Grk5l morphants (arrow). Cartoon depicts heart morphology and blood flow. A, atrium, V, ventricle. (O) Summary of heart looping after injection with MOs targeting either Grk2/3 or Grk5l. For Grk5l, three different MOs were tested. D, D-loop, N, no loop, L, L-loop. CTRL MO versus Grk5l MO: p < 0.0001; CTRL MO versus Grk5l MO2: p < 0.0001; CTRL MO versus Grk5l MO3: p < 0.0001. All images: 48–52 hpf (F–M). See also Figure S1 and Table S1. |
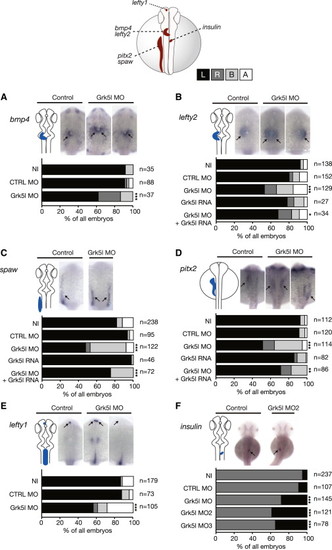
Grk5l Governs LR Asymmetry Development WMISH for leftward marker genes at 20–22 ss with the respective expression domain outlined next to the images. Bar graphs display percentages of expression on the left side (black), the right side (dark gray), and both sides of the midline (light gray), or no expression at all (white). (A) bmp4 expression in the heart region is randomized upon Grk5l KD. CTRL MO versus Grk5l MO: p = 0.0056. (B) Random distribution of lefty2 can be partially rescued by grk5l RNA. CTRL MO versus Grk5l MO: p < 0.0001; Grk5l MO versus Grk5l MO+grk5l RNA: p = 0.0425. (C) spaw in the LPM is affected upon loss of Grk5l, but can be rescued by coinjection of grk5l mRNA. CTRL MO versus Grk5l MO: p < 0.0001; Grk5l MO versus Grk5l MO+grk5l RNA: p = 0.0002. (D) Ambiguous pitx2 reversed by mRNA encoding for grk5l. CTRL MO versus Grk5l MO: p < 0.0001; Grk5l MO versus Grk5l MO+grk5l RNA: p = 0.0068. (E) Lefty1 transcripts in the dorsal diencephalon are ambiguously distributed when Grk5l is lost. CTRL MO versus Grk5l MO: p < 0.0001. (F) Loss of Grk5l interferes with pancreas placement, as can be seen by the expression of insulin. CTRL MO versus Grk5l MO: p = 0.0009; CTRL MO versus Grk5l MO2: p < 0.0001; CTRL MO versus Grk5l MO3: p < 0.0001. EXPRESSION / LABELING:
PHENOTYPE:
|

Grk5l Acts in the Organ of Laterality (A) Combined WMISH for gsc, ntl, and pax2 (10 hpf). DFCs cluster normally at 90% epiboly as shown by sox17 (n = 32–35). Live imaging at 8 ss shows that the KV forms. Arrows indicate KV; higher magnification in inset. (B) KV-specific KD did not alter KV area as assessed by PKCζ staining at 8 ss. n = 14–19 embryos. CTRL MO: 1,793 ± 299 μm2, Grk5l MO: 1,555 ± 277 μm2. Bar graph displays means ± SEM. (C) Outline of KVs upon injection of CTRL MO (blue) or Grk5l MO (red). Depending on the respective size, the KV is shown in darker or brighter shading. n = 12–17 embryos. (D) Impaired heart looping by Grk5l depletion in KV cells detected by cmlc2 ISH at 50 hpf. CTRL MO versus Grk5l MO: p < 0.0001. (E) insulin-positive cells of the pancreas are more often on the left side of the midline upon KV-specific KD of Grk5l. CTRL MO versus Grk5l MO: p = 0.0007. (F) KV-directed ablation of Grk5l randomizes spaw. CTRL MO versus Grk5l MO: p < 0.0001; CTRL MO versus Grk5l MO2: p = 0.0002. (G) Grk5l localizes to primary cilia in NIH 3T3 cells and motile cilia in the developing zebrafish kidney. Images show Grk5l-GFP after transfection in cells or injection of capped RNA into one-cell-stage embryos. Scale bars, 3 μm (NIH 3T3), 20 μm (low magnification of pronephros), and 10 μm (higher magnification). (H) Elongation of motile cilia of the zebrafish pronephros (2 dpf). Cilia in the distal (CTRL MO: 3.571 ± 0.116 μm, Grk5l MO: 4.090 ± 0.0852 ¼m) and proximal part (CTRL MO: 6.347 ± 0.318 μm, Grk5l MO: 8.526 ± 0.220 μm) were analyzed. Approximate areas of analysis are indicated in red in the live image of a 2 dpf zebrafish tail. Scale bar, 10 μm. (I) Bar graph summarizing pronephric cilia measurements as means ± SEM (n = 32–101 cilia). (J) Motile cilia at 8 ss with MOs targeted to KV cells. Images were selected for cilia length. Scale bar, 10 μm. (K) Cilia number was not altered in the KV by MOs targeted to the KV (8 ss). n = 14–19 embryos. CTRL MO: 34.14 ± 3.372 cilia; Grk5l MO: 28.53 ± 2.960 cilia. (L) Grk5l depletion in the KV increases cilia length. n = 460–513 cilia at 8 ss. CTRL MO: 3.344 ± 0.049 μm; Grk5l MO: 3.748 ± 0.054 μm; p < 0.0001, two-tailed, unpaired t test. Bar graph displays means ± SEM. See also Figure S2<. EXPRESSION / LABELING:
PHENOTYPE:
|

Grk5l Limits mTOR Signaling (A) Western blot analysis of zebrafish embryos (6–8 ss) for S6K1 phosphorylation. Representative images of a single blot are shown. Bar graph displays means ± SEM. (B) Western blot of mouse heart lysates of WT and GRK5 KO mice for phosphorylation of S6K1 and its target ribosomal protein S6. Bar graph displays means ± SEM. (C) Overexpression of Grk5l-GFP in cells attenuates TORC1 activity toward S6K1. Bar graph displays means ± SEM. (D) Cell volume of Grk5l transfected cells (left: mean ± SEM). Cells were controlled for grk5l expression (right graph: means ± SD, n = 2–3). (E) Reversal of the Grk5l lateralization phenotype by rapa. Analysis of spaw in the presence of DMSO or rapa from 6 to 10 hpf. CTRL MODMSO versus Grk5l MODMSO: p < 0.0001; Grk5l MODMSO versus Grk5l MORapa: p = 0.0033. (F) Inhibition of S6K1 activity by PF-470871 reverses spaw misexpression upon Grk5l KD. CTRL MODMSO versus Grk5l MO2DMSO: p = 0.0063; Grk5l MO2DMSO versus Grk5l MO2PF: p < 0.0001. (G) Coimmunoprecipitation of transfected GFP or hemagglutinin (HA)-Grk5l-GFP and endogenous Raptor using an HA antibody. IP, immunoprecipitation; WCL, whole-cell lysate. (H) Relative expression levels of grk5l obtained by qPCR (mean ± SD, n = 2). (I) raptor mRNA levels (mean ± SD, n = 2). See also Figures S2, S3, and S4. EXPRESSION / LABELING:
PHENOTYPE:
|

Grk5l Is the Closer Homolog of Human GRK5, Related to Figure 1 (A) Multiple protein sequence alignment of both zebrafish Grk5 variants to human GRK5 (CAI15804.1) indicates that Grk5l (OTTDARP00000028829) is the variant with more homology to human GRK5. Amino acids conserved between both zebrafish proteins and human GRK5 are colored in blue. Residues identical between zebrafish Grk5 (OTTDARP00000033957) and human GRK5 are indicated in light blue, whereas those conserved between Grk5l and its human homolog are marked in orange. drGrk5, danio rerio Grk5; drGrk5l, danio rerio Grk5l; hsGRK5, Homo sapiens GRK5. (B) Table displaying the percentage of amino acids identical or similar (in brackets) between zebrafish and human GRKs. Human GRK2 (NP_001610.2), zebrafish Grk2/3 (ACH56535.1). (C) Western blot of whole embryo lysates (24 hpf). Zebrafish were left either uninjected (NI) or were control injected (CTRL MO) or injected with a translation blocking MO (Grk5l MO). Probing with an anti-GRK5 antibody revealed a decrease in Grk5l protein in morphant embryos. Gapdh was used as loading control. (D) Autoradiogram showing the binding efficiency of the Grk5l MO 1, 2 and 3. In vitro translation of GFP-tagged Grk5l was performed in the presence of CTRL and translation blocking MOs using a cell-free reticulocyte lysate and 35S-labeled methionine for detection. As template, pCS2+GFP containing parts of the 52UTR fused to the ORF of Grk5l was used. (E) Knockdown of Grk5l does not affect grk5 levels in zebrafish embryos. Bar graph displays relative levels of grk5 normalized to gapdh as mean ± SEM n = 4-6. p = 0.45, two-tailed t test. (F) Live images of 48 hpf embryos, which were left uninjected (NI) or were injected with either CTRL MO, Grk5l MO, GRK5l MO2 or Grk5l MO3 at the one cell stage. Arrows indicate pericardiac edema developing in Grk5l morphants. Arrowheads point toward curled tails, which can be an indication of a ciliary defect. Bar graph summarizes 3 to 8 experiments and displays as means ± SEM. Grk5 CTRL MO versus Grk5l MO: p < 0.0001, two-tailed t test, Grk5 CTRL MO versus Grk5l MO2: p < 0.0001, one-tailed t test, Grk5 CTRL MO versus Grk5l MO3: p < 0.0001, one-tailed t test. n = 76 to 274 embryos in total. (G) Heart looping is also disturbed when Grk5 alone or along with Grk5l is knocked down. WMISH for cmlc2. CTRL MO here describes a five-base mismatch MO for Grk5. (H) Bar graph summarizing heart looping experiments as shown in (F). D, D-loop, N, no loop, L, L-loop. Grk5 CTRL MO versus Grk5 MO: p < 0.0001, Grk5 CTRL MO versus Grk5 MO combined with Grk5l MO: p = 0.0002; Fisher’s exact test. |

grk5l and raptor Are Similarly Spatially Expressed, Related to Figures 3 and 4 Expression analysis by in situ hybridization reveals an overlapping pattern for grk5l and raptor during early development. (A) grk5l is already maternally supplied. Picture shows expression at the 4 cell stage. (B) Maternal expression of grk5l persists at the 16 cell stage. (C) grk5l expression at the 256 cell stage. Animal view. (D) At 10 hpf, grk5l is expressed in the tailbud region. Dorsal view. (E) Flatmount of 4 ss embryo showing stronger grk5l expression in the tailbud region. Anterior to the left. (F) Closeup of tailbud expression (4 ss). (G) During somitogenesis, grk5l is ubiquitously transcribed at low levels. However, stronger expression can be detected in the tailbud region (12 ss). (H) grk5l is enriched in the otic placode. (I) At 24 hpf, grk5l is most highly expressed in the head. (J) From 2 dpf on, grk5l expression becomes more restricted and can also be detected in the pronephros. (K) Higher magnification of the tail of a 2 dpf embryo highlighting the expression of grk5l in the neural tube, the notochord and the pronephros. (L) Weak, but ubiquitous expression of raptor at the tailbud stage. Lateral view, dorsal to the right. (M) Spatially unrestricted expression of raptor during somitogenesis (8 ss). (N) At 24 hpf, raptor is most highly expressed in the head and the tail. (O) Overlapping with grk5l, raptor transcripts can be detected in the head and also weakly in the tail of 2 dpf embryos. (P) Higher magnification of the tail of a 2 dpf embryo highlighting the expression of raptor. Although the expression appears to be generally lower than grk5l, it is similar in the neural tube, the notochord and the pronephros. |

Heterotaxy Phenotype Is Not Due to Altered α1-Adrenergic GPCR Signaling or Changed Expression of Key Components of Hh and RA Signaling, Related to Figure 4 (A) Overstimulation of α1b-adrenergic receptors was shown to be causative for situs inversus in a rat model. As GRKs are considered the terminating enzymes in the signaling of GPCRs, loss of GRK activity could theoretically result in a situation similar to receptor overstimulation. However, as measured by lefty2 in situ hybridization at 22 ss, the phenotype upon loss of function of Grk5l is not caused by increased activity of the α1b-adrenergic receptor. Subtype-specific inhibition of α1b-adrenoceptors by treatment with WB-4101 from pregastrulation stages (5 hpf) on did not rescue the Grk5l depletion phenotype. Bar graph displays summary of three independent experiments. CTRL MODMSO versus Grk5l MODMSO: p < 0.0001; Grk5l MODMSO versus Grk5l MOWB-4101: p = 0.6699; Fisher’s exact test. (B–B2)2 Expression of the Hh target gene patched 1 (ptc1) remains unchanged after KD of Grk5l. B noninjected; (B2) injected with control MO; (B3) injected with Grk5l MO. (C–C3) Expression pattern of cytochrome P450 family 26 subfamily A polypeptide 1 (cyp26a1), a key component of RA signaling, is unchanged after KD of Grk5l. (C) noninjected; (C2) injected with control MO; (C3) injected with Grk5l MO.) (D–D3) Expression of fibroblast growth factor 8 (fgf8), a target of retinoic acid signaling, is not changed upon KD of Grk5l. (D, noninjected; (D2) injected with control MO; (D3) injected with Grk5l MO. (E–E3) Similar to Grk5, Grk5l regulates canonical wnt signaling in a positive fashion. Loss of either zebrafish Grk5 variant causes downregulation of the wnt target gene axin2. |

Rapamycin Rescues the Lateralization Phenotype also during Ciliogenesis Stages and upon Ablation of Grk5l in the KV, Related to Figure 4 (A) Rapamycin treatment from tailbud stage (10 hpf) rescues the Grk5l phenotype similarly to the treatment during gastrulation. Same day clutches of NI, CTRL MO and Grk5l MO injected embryos were treated with rapamycin from 10 hpf on. Bar graph of spaw misexpression. CTRL MODMSO versus Grk5l MODMSO: p < 0.0001; Grk5l MODMSO versus Grk5l MORapamycin: p = 0.0152; Fisher’s exact test. (B) Coimmunoprecipitation of endogenous GRK5 with endogenous Raptor from HEK293T cells. Asterisks indicate unspecific background staining in the rabbit IgG control, which originates from crossreaction with the secondary anti-rabbit antibody. IP, immunoprecipitation; WCL, whole cell lysate. (C) Randomized spaw expression caused by KV-specific depletion of Grk5l can be normalized by rapamycin treatment from 6 to 10 hpf. CTRL MODMSO versus Grk5l MODMSO: p < 0.0001; Grk5l MODMSO versus Grk5l MORapamycin: p = 0.0017; Fisher’s exact test. |